

What image of analytics is usually thought of as typical? Tables, graphs, numbers… What if a different system existed, the one capable of comprising priority multidimensional and dynamic KPIs – from team engagement rate and customer orientation to market position, social benefit and corporate learning efficiency?
Cross-cutting strategic metric, single entities’ data (departments), core and secondary processes, long-term and short-term tasks, statistics and dynamics… Like mosaics pieces, they develop into a structured and coherent digital map of the organization and can therefore be used by various stakeholders. This is what we call the SAPI Globe – Stakeholders Agile Performance Indicators
Multi-dimensional, dynamic and flexible efficiency map.
The Globe is a metaphorical shape that allows us to summarize the priority qualitative and quantitative indicators, depending on the stakeholders’ tasks.
The equator represents key (core) operational process which demands constant attention. The equator is then intersected with meridians – cross-cutting strategic goals which are analyzed by taking into account the implementation and execution of their specific tasks. The continents represent departments responsible for processes.
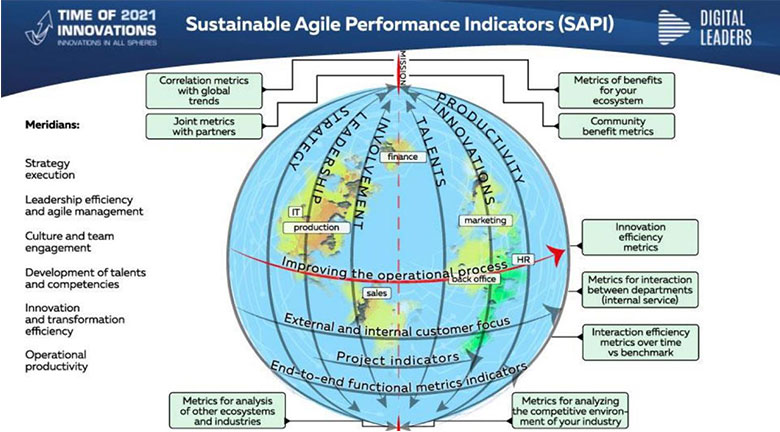
The lines that can be seen on this multi-dimensional map represent the indicators to be evaluated. The HR department deals with employee engagement statistics, their reflections of the organization etc. The marketing department considers reputation analytics, traffic segments, channels conversions, etc.
Continents may be evaluated from different perspectives.
- Locally, within the framework of a single task or the work of a specific department.
- At the intersection of several processes (omnichannel analytics). Marketing affects sales, sales affect production and logistics, logistics affect sales.
- By segments and priorities. Today, sales figures are important, while tomorrow the priorities shift towards reputation analytics.
- From top to bottom (from the general to the specific) and from bottom to top (from the specific to the general). Regular team’s, customers’ and partners’ opinions monitoring within the organizational ecosystem takes into account the interests of society and other stakeholders.
- From the point of view of the organization itself (customer orientation, productivity improvement, innovation) and its external communications (following global trends, social benefits, prompt and reliable relationships with the partners).
The Globe concept eliminates linear thinking and created a multi-dimensional perspective instead. Furthermore, it does not only focus only on current issues, but is also capable of monitoring different time lapses, strategic and seasonal indicators.
It even allows to monitor aspects that do not currently constitute a part of the project: data on cancelled orders and unrealized opportunities, labor market reflections, innovations potential, improvements application, hence quality increase, social interaction. It offers new perspectives, too: potential requests and growth points of the organization’s ecosystem that could not be detected previously since they were out of system’s reach.
SAPI Globe Concept: extending the boundaries of KPIs
In our pursuit to create an approach which can be widely and successfully used in the modern ecosystem, we have studied numerous scientific models and systems: researches by Malo, Norton-Kaplan, Meisel, Stern, Drucker, Roberts and Adams…
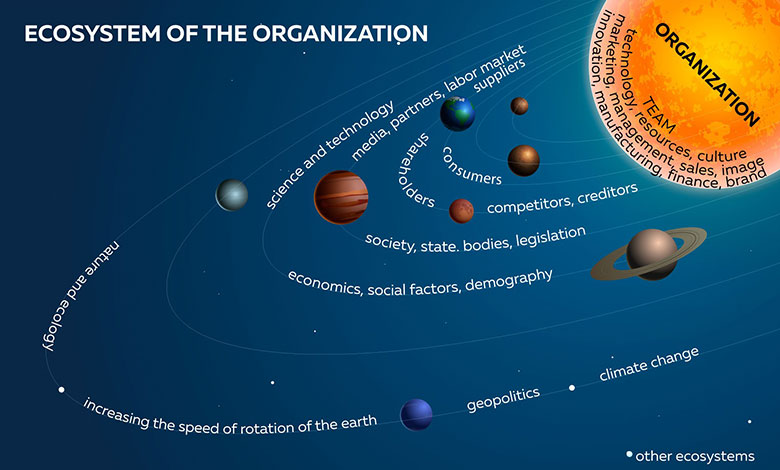
We have expanded the set of metrics by adding various stakeholders related to corporate culture: suppliers, partners, government agencies, the media, and society. We have also considered the influence of the relationships within a team, it’s values and willingness to achieve qualitative and quantitative indicators.
As a result we have developed a much more complete image which comprises a variety of factors of the organization’s ecosystem as well as external influences.
Each organization needs a unique Globe of indicators.
The SAPI Globe can be used in any project by equipment suppliers, scientific institutes, beauty salons, online business schools, hospitals, industrial enterprises etc. The Globe adapts to the project with the consideration of priorities, project’s specific characteristics and may be changed or configured in the process.
Train Your Brain experts require 2 or 3 months to develop a functional map and optimize the processes within the organization. Sometimes deadlines shift due to delays at the approval stage: people have their own opinion regarding the necessity of changes and innovations. This aspect should also be accounted for. Moreover, the whole team should be involved in the system of creating and monitoring metrics.
Analytics does not turn into an end in itself or endeavors to measure all the indicators possible. The key questions we ask managers are: “What do you plan to measure and what are your priorities in respect with the target audience?” The answer becomes the foundation for strategic metrics that will be applied in the future.
This is one of the reasons for hiring a specialist from the outside in order to consider the situation from the point of view of an observer rather than that of a stakeholder. All the necessary detailed will be then provided by the organization’s employee.
Dynamic analytics – a trigger for changes and a look into the future.
Dynamic metrics help us determine the potential of the organization – what it will be like in a year or two or a decade. We can detect weak spots and unoptimized processes. This is quite a trendy topic nowadays. Dynamic indicators have long been used in experimental chemistry and in production, while measuring when assessing website traffic or traffic jams (when the traffic density is divided into sections with green, yellow and red colors and the points show the density at any given moment. 2-3 points – we are good to go, 10 points – here we go again!).
However, if several or prevailing number of indicators are dynamic, it becomes a daunting task to measure and compare everything at once. Each indicator becomes a small ‘magnet’ which affects the overall vector. It’s up to us to decide whether to use them as points of growth and increase productivity or ignore them.
For example,
In one of the regional clinics, an analysis of detailed indicators by hours and days helped to conclude that it was possible to increase the attendance of a speech therapist and psychologist on Sundays if you open an appointment to other specialists for that day. Now specialists work a full shift, and the clinic provides a larger volume of services.
The situation changes in summer, which requires dynamics evaluations to analyze the changes and then test and apply changes that will increase productivity. Detailed analytics acts as an incentive for development and helps to take timely measures.
There are also top-level indicators: economic forecasts, changes in inflation rates, trends … Everything is changing at a rapid pace, so we have to conduct analytics regularly to withstand the pressure of modern tendencies.
Dynamic KPIs aren’t a novelty anymore. They broaden our horizons and allow us to keep up with the times of even shape the future instead of constantly looking back.
The Globe SAPI concept reflects the changes that strategic management undergoes in the digital environment. Thinking within an ecosystem, innovations, speed of change implementation, organizational flexibility, engagement of all key stakeholders are priority indicators of sustainable development of organizations in the rapidly changing world.
Oxana Nabok
http://nabok.trainyourbrain.eu.com
Managing partner of Train your brain consultancy agency http://trainyourbrain.eu.com
Head of change management committee of Digital Experts Association http://deassn.ru
EFQM business excellence European model assessor